1 Introduction to C++
Why C++?
Back in the 1980s, C was the dominant programming language. Even though it was way faster and allowed for more memory control than other languages, it was not easy to use, unsafe, and lacked important abstraction features such as object-oriented programming or generic programming.
To address these issues, Bjarne Stroustrup created C++ in 1983. C++ is a superset of C, meaning that all valid C code is also valid C++ code. It adds many features to the language, such as classes, templates, and exception handling. These features are crucial for writing large and complex software systems, as they allow for better code organization, reusability, and maintainability.
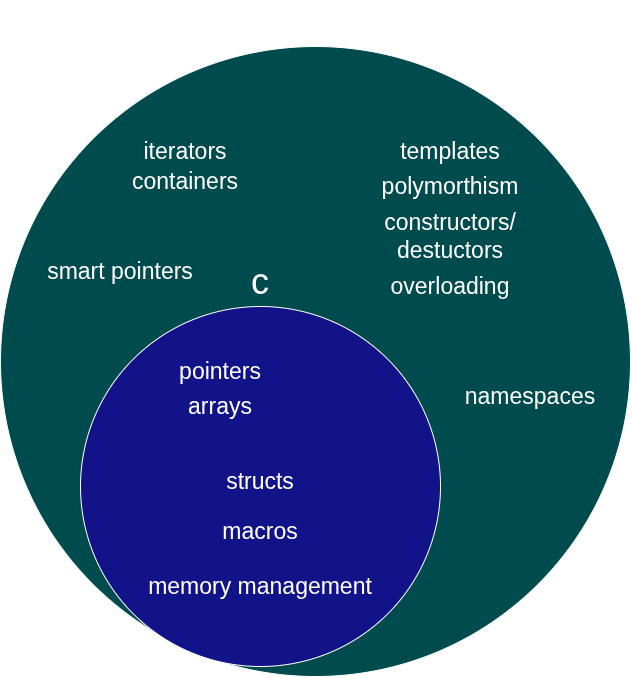
Let’s compare different programming languages in terms of performance, safety, and abstraction:
| Language | Performance | Safety | Abstraction | Execution | Memory Usage | Compilation Time |
|---|---|---|---|---|---|---|
| C++ | Very High | Medium | High | Compiled | Low | Very Slow |
| C | Very High | Low | Low | Compiled | Very Low | Fast |
| Java | Medium | High | High | JVM Bytecode | Medium | Medium |
| Python | Low | High | High | Interpreted | High | None |
| Julia | High | High | High | JIT Compiled | Medium | Medium |
| Rust | Very High | Very High | Medium | Compiled | Low | Slow |
C++ is a great choice for complex performance-critical applications, such as game engines, operating systems, and high-frequency trading systems. It is also widely used in scientific computing, embedded systems, and other domains where low-level control over hardware is required.
Coding Environment Setup
There are many ways to set up a coding environment for C++. I’ll show a simple setup using Visual Studio Code (VS Code) and the GCC compiler. You can find a detailed step-by-step guide on this GitHub repository: https://github.com/daniel-schwarzenbach/Cpp-for-Beginners
If you want just to quickly try out some C++ coding, I can highly recommend using the compiler explorer at: https://gcc.godbolt.org/.
Your First C++ Program
When non-programmers think of a program or an app, they usually think of clicking on an icon and then interacting with a graphical user interface (GUI). However, the first programs that most programmers write are simple console applications that run in a terminal or command prompt. These programs take input from the user, perform some calculations or operations, and then display the output.
For example, a simple program that prints “Hello, World!” to the console is often used as a first program to demonstrate the basic syntax and structure of a programming language.
First create a new file called hello.cpp and add the following code:
// import the standard input-output stream library
#include <iostream>

// the main function - execution starts here
// int is the return type of the function, indicating that it returns an integer value
// the empty parentheses `()` indicate that the function takes no arguments
int main() {
    // print "Hello, World!" to the console
    // cout stands for "console output" and is used to output data to the console
    // << is the insertion operator, which inserts the data into the output stream
    // std::endl is used to insert a newline character and flush the output buffer
    std::cout << "Hello, World!" << std::endl;
    // return 0 indicates that the program ended successfully without errors
    return 0;
}
then compile and run the program in your terminal:
on Linux
you can open a terminal by hitting Ctrl + Alt + T or searching for “Terminal” in your applications menu. Then navigate to the directory where you saved the hello.cpp file using the cd command. For example, if you saved the file in a folder called ~/Desktop/cpp_projects on your desktop, you would type:
cd ~/Desktop/cpp_projectsg++ hello.cpp -o hello # compile the program and create an executable file called "hello"
./hello # run the executable file, which will print "Hello, World!" to the consoleThen you should see the output:
> Hello, World!The Compiler
In short, a compiler is a program that translates source code written in a programming language (like C++) into machine code that can be executed by a computer’s CPU. The process of compiling involves several steps, including lexical analysis, parsing, semantic analysis, optimization, and code generation.

GCC Compiler
The most widely used C++ compiler is the GNU Compiler Collection (GCC). It is an open-source compiler that supports multiple programming languages, including C, C++, and Fortran. GCC is available for various platforms, including Linux, Windows, and macOS.
Flags
When compiling a C++ program, you can pass flags to g++ to control the compiler’s behavior. Here is an overview of the most important categories:
Output & Input
| Flag | Description |
|---|---|
-o <file> |
Set the output filename (e.g., -o hello) |
-c |
Compile only; produce a .o object file, do not link |
-E |
Run the preprocessor only and print to stdout |
-S |
Compile to assembly (.s) without assembling |
C++ Standard
| Flag | Description |
|---|---|
-std=c++17 |
Use the C++17 standard |
-std=c++20 |
Use the C++20 standard |
-std=c++23 |
Use the C++23 standard |
It is good practice to always specify the standard explicitly.
Warnings & Errors
| Flag | Description |
|---|---|
-Wall |
Enable all common warnings |
-Wextra |
Enable extra warnings beyond -Wall |
-Wpedantic |
Enforce strict ISO C++ conformance |
-Werror |
Treat all warnings as errors |
Optimization
| Flag | Description |
|---|---|
-O0 |
No optimization (default; fastest compilation, easiest to debug) |
-O1 |
Basic optimization |
-O2 |
Moderate optimization — good for release builds |
-O3 |
Aggressive optimization — maximum speed |
-O5 |
Experimental optimization (may not be supported in all versions) |
-Os |
Optimize for binary size |
Debugging
| Flag | Description |
|---|---|
-g |
Include debug symbols (needed for debuggers like gdb) |
-g3 |
Include maximum debug information, including macro definitions |
-fsanitize=address |
Enable AddressSanitizer to detect memory errors at runtime |
-fsanitize=undefined |
Enable UndefinedBehaviorSanitizer |
Linking & Libraries
| Flag | Description |
|---|---|
-I<dir> |
Add a directory to the header search path |
-L<dir> |
Add a directory to the library search path |
-l<name> |
Link against a library (e.g., -lm for libm) |
Example: A Typical Development Build
g++ -std=c++17 -Wall -Wextra -g -fsanitize=address -o hello hello.cppExample: A Typical Release Build
g++ -std=c++17 -O2 -o hello hello.cppDebugging with GDB
When your program crashes or produces wrong results, a debugger lets you pause execution, inspect variables, and step through code line by line — far more powerful than sprinkling std::cout statements everywhere.
GDB (GNU Debugger) is the standard debugger for C/C++ on Linux and macOS. VS Code wraps it with a graphical interface so you rarely need to type GDB commands by hand, but understanding them helps you work faster and understand what the debugger is actually doing.
Step 1 — Compile with Debug Symbols
The compiler strips variable names and line numbers from the final binary by default. To make the program debuggable, pass the -g flag:
g++ -std=c++17 -g -o hello hello.cppNever use
-O2/-O3together with-gwhile debugging — optimizations reorder and eliminate code, making stepping through it confusing.
Step 2 — Launch GDB
gdb ./helloYou will see the GDB prompt (gdb). From here you control execution with commands.
Essential GDB Commands
| Command | Shortcut | Description |
|---|---|---|
run |
r |
Start the program |
quit |
q |
Exit GDB |
break <location> |
b |
Set a breakpoint (e.g., b main, b hello.cpp:10) |
info breakpoints |
i b |
List all breakpoints |
delete <n> |
d <n> |
Delete breakpoint number n |
next |
n |
Execute the next line (step over function calls) |
step |
s |
Execute the next line (step into function calls) |
continue |
c |
Resume until the next breakpoint |
finish |
fin |
Run until the current function returns |
print <expr> |
p |
Print the value of a variable or expression |
display <expr> |
Print an expression automatically after every step | |
backtrace |
bt |
Show the call stack (useful after a crash) |
frame <n> |
f <n> |
Switch to a specific stack frame |
list |
l |
Print the surrounding source code |
A Minimal Example
Consider this buggy program:
#include <iostream>

int divide(int a, int b) {
    return a / b; // bug: b could be 0
}

int main() {
    int x = 10, y = 0;
    std::cout << divide(x, y) << std::endl;
    return 0;
}
Compile and debug it:
g++ -std=c++17 -g -o buggy buggy.cpp
gdb ./buggy
Inside GDB:
(gdb) b divide          # set a breakpoint at the start of divide()
(gdb) run               # start the program — it stops at the breakpoint
(gdb) p a               # prints: $1 = 10
(gdb) p b               # prints: $2 = 0  ← found the bug!
(gdb) backtrace         # shows how we got here
(gdb) quit
Inbuilt Debugger in VS Code/Codium
VS Code’s inbuilt debugger provides the same capabilities through a graphical interface, without needing to remember GDB commands.
Setup:
- Install the C/C++ extension by Microsoft.
- Open your
.cppfile and click in the left margin next to a line number to set a breakpoint (a red dot appears). - Press
F5(or go to Run → Start Debugging). VS Code will compile with-gand launch GDB automatically.
Key UI panels while paused:
| Panel | What it shows |
|---|---|
| Variables | All local variables and their current values |
| Watch | Expressions you add manually to monitor |
| Call Stack | The chain of function calls that led here |
| Breakpoints | A list of all breakpoints you have set |
Key shortcuts:
| Action | Shortcut |
|---|---|
| Continue | F5 |
| Step Over | F10 |
| Step Into | F11 |
| Step Out | Shift+F11 |
| Stop | Shift+F5 |
For most day-to-day debugging the VS Code UI is sufficient. Fall back to raw GDB commands when working on a remote server over SSH or when you need advanced features like conditional breakpoints on the command line (b hello.cpp:10 if x == 0).